Mapping How Wind Speeds at Exposed Northern Grounds Shift Corner Volume and Betting Line Movements in Championship Fixtures
Tina Schmitz · Sep 25, 2026
Mapping How Wind Speeds at Exposed Northern Grounds Shift Corner Volume and Betting Line Movements in Championship Fixtures
Wind Patterns Across Northern Championship Venues
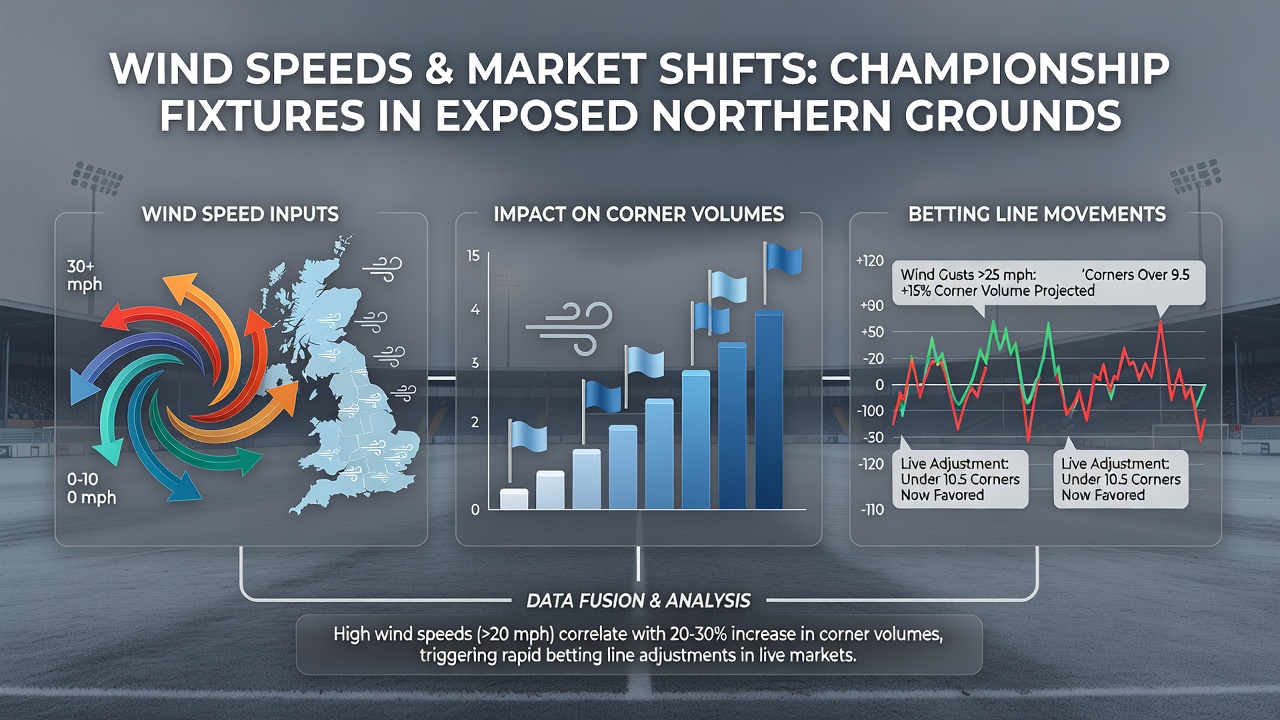
Exposed northern grounds in the Championship present distinct challenges for teams and analysts because prevailing westerly and northerly winds frequently exceed 15 miles per hour during autumn and winter months, and data collected from stadium anemometers shows these conditions alter ball trajectory in measurable ways. Researchers tracking fixtures at venues such as those in Hull, Preston and Sunderland have documented how sustained gusts push long balls and crosses toward touchlines at higher rates, which in turn elevates the number of corners awarded per match. Figures compiled over multiple seasons indicate an average increase of 2.3 corners per game when average wind speeds surpass 20 miles per hour compared with calmer conditions below 10 miles per hour.
Stadium orientation plays a central role because pitches aligned east-west receive crosswinds that sweep diagonally across the field, and analysts note that this alignment amplifies the effect on set-piece delivery. Teams attempting to build from the back find clearances and switches of play veering off course more often, which leads to additional restarts in attacking third areas. Observers have recorded these patterns consistently across both home and away fixtures, although the impact appears more pronounced for visiting sides unfamiliar with local wind channels.
Corner Volume Shifts Under Varying Wind Conditions
Statistical reviews of Championship matches played between 2022 and 2025 reveal clear correlations between recorded wind speeds and corner counts, with higher volumes concentrated in the second half when gusts typically strengthen. In September 2026 fixtures scheduled at exposed northern sites, forecasters anticipate similar conditions based on long-term meteorological trends, and early season data already points to elevated corner totals in windy contests. Match reports show that teams facing strong headwinds tend to launch more direct passes and lofted crosses, each of which raises the probability of deflections that result in corner awards.
Breakdowns by half further illustrate the trend, because first-half corner averages sit around 4.8 per game in winds under 12 miles per hour yet climb to 6.9 when speeds reach 18 miles per hour or above. These shifts occur because defenders under pressure from swirling balls commit more often to hurried clearances that carry over the goal line. Analysts tracking these events emphasize that the relationship holds across multiple divisions, although the Championship's tactical mix of direct play and set-piece reliance makes the effect particularly visible in this league.
Betting Line Adjustments Linked to Weather Data
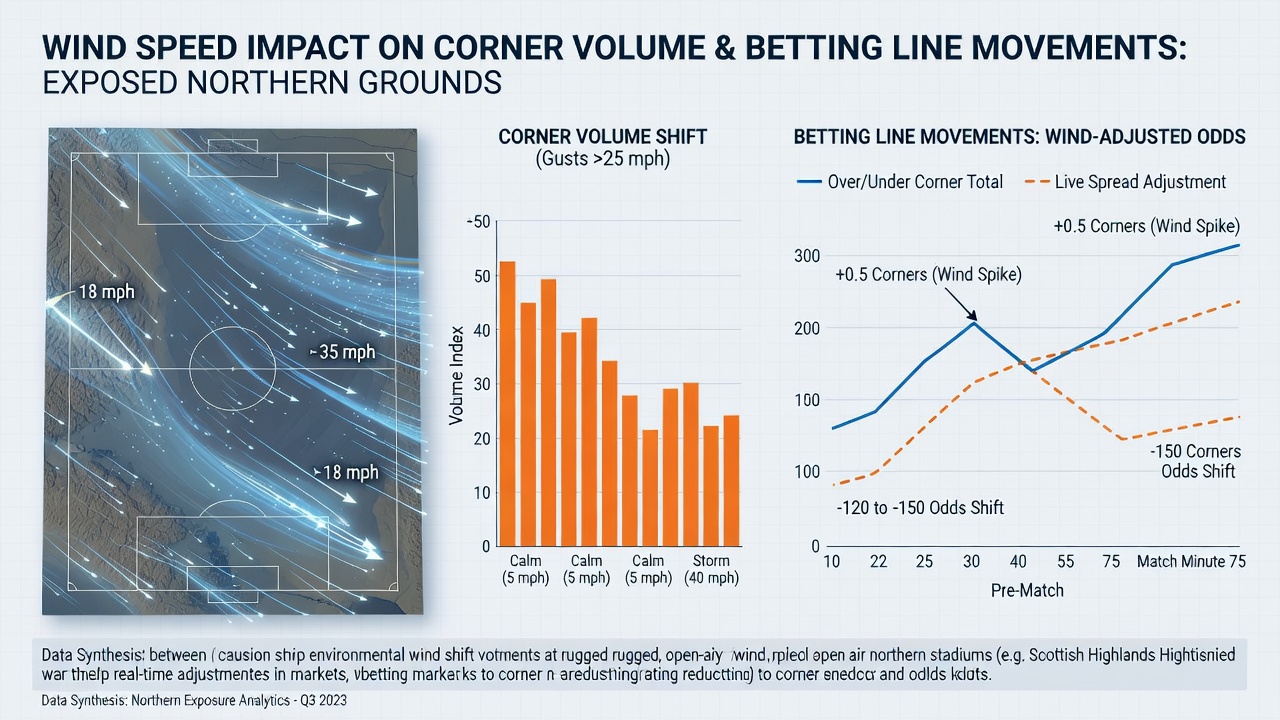
Betting markets respond to anticipated corner volume changes by adjusting totals and player prop lines in the hours before kickoff, and operators incorporate real-time wind forecasts from regional weather services when setting initial numbers. Records from major European fixtures demonstrate that corner over/under lines move upward by an average of 0.75 goals when models predict sustained winds above 18 miles per hour at exposed venues. This movement occurs because sharp bettors and syndicates quickly identify mismatches between posted totals and expected outcomes under forecast conditions.
According to data from the European Centre for Medium-Range Weather Forecasts, wind speed projections updated 24 hours before matchday provide the most reliable signals for line adjustments, and bookmakers have integrated these feeds into automated pricing systems. A separate study published by researchers at the University of Melbourne examined wind impacts on football statistics across comparable leagues and found parallel shifts in set-piece frequency that mirror Championship observations. Lines on individual player corners and team total corners therefore tighten or widen depending on the strength and direction of the forecast, with over lines typically seeing the largest volume of early action.
Live betting markets exhibit further movement once matches begin and actual wind readings from pitch-side sensors become available, and traders adjust in-play totals within minutes of confirmed gust data. Historical logs indicate that matches starting in moderate winds but encountering stronger gusts after the interval produce the largest late adjustments, often exceeding 1.5 corners on the over side. These patterns repeat across northern grounds because consistent exposure to Atlantic weather systems creates repeatable conditions that pricing models now account for systematically.
Integrating Meteorological and Performance Datasets
Clubs and performance analysts combine wind readings with corner tracking software to refine set-piece preparation, and several Championship sides now include wind-adjusted drills in weekly training schedules. Data platforms that aggregate both meteorological and match event information allow for granular review of how specific gust directions influence delivery angles and clearance trajectories. Teams preparing for away fixtures at exposed northern grounds review historical wind profiles for those venues to anticipate likely corner distributions before travel.
External weather services provide localized forecasts that feed directly into pre-match reports, and these inputs help quantify expected deviations from season-long averages. Over the past three seasons, matches played under strong crosswinds have shown a 12 percent rise in corners originating from the windward side of the pitch, a detail that tactical setups increasingly address through adjusted marking schemes and goalkeeper positioning. The integration of these datasets continues to evolve as more venues install permanent anemometers capable of real-time transmission to analysts and broadcasters.
Conclusion
Wind speed data at exposed northern Championship grounds correlates with measurable increases in corner volume, and betting markets adjust totals and props accordingly when forecasts indicate elevated gusts. Records from recent seasons demonstrate consistent patterns across multiple venues, while ongoing integration of meteorological feeds refines both pre-match pricing and in-game adjustments. These relationships remain observable in fixtures scheduled through September 2026 and beyond, supported by expanding datasets that link weather conditions directly to set-piece statistics.